Performance, in context

Find the edge
between the lines.

Explore 4,406 NCAA Division I player-season records and see how offensive production separates the teams that score.

4,406player-season records
across two seasons

The landscape

Production clusters around the winning edge.

Each dot is a team. Teams that reach base more often often also produce more total bases, so the measures tend to rise together. This association is not proof of cause. Hover for details.

On-base percentage vs. slugging percentageTeam-season averages · 2021–22
OBPOn-base percentage: how often a batter reaches base through a hit, walk, or hit-by-pitch.
SLGSlugging percentage: total bases per at-bat, a quick measure of hitting power.
OPSOn-base plus slugging: OBP + SLG, a combined measure of reaching base and power.
.340average team OBP
in the top quartile
.417average team SLG
in the top quartile
2 yrsof Division I data
in this snapshot

Know the dataset

What is in this snapshot?

Each row represents one player in one NCAA Division I season. The SCORE Network batting files combine traditional production, plate discipline, speed, and playing-time measures so you can compare both role players and everyday contributors.

4,406player-seasons
—unique players
22columns per row
—teams represented

Build your cut

Stat Explorer

Choose a population and metric to compare player production across the Division I field. The table below keeps more of the ranked player list in view, while the scatter plot shows every filtered record.

The source file labels every record “All Division I”; it does not include conference-level records.

Top players by Batting AverageLoading…
Metric vs. playing timeHover for player detail

Filtered records

Player-level detail

PlayerTeamSeasonGPBAOPSHRRBI

A data story

The Rise of the
Power Hitter

Home runs are changing the shape of college softball offense. Here is what that shift means for the modern lineup.
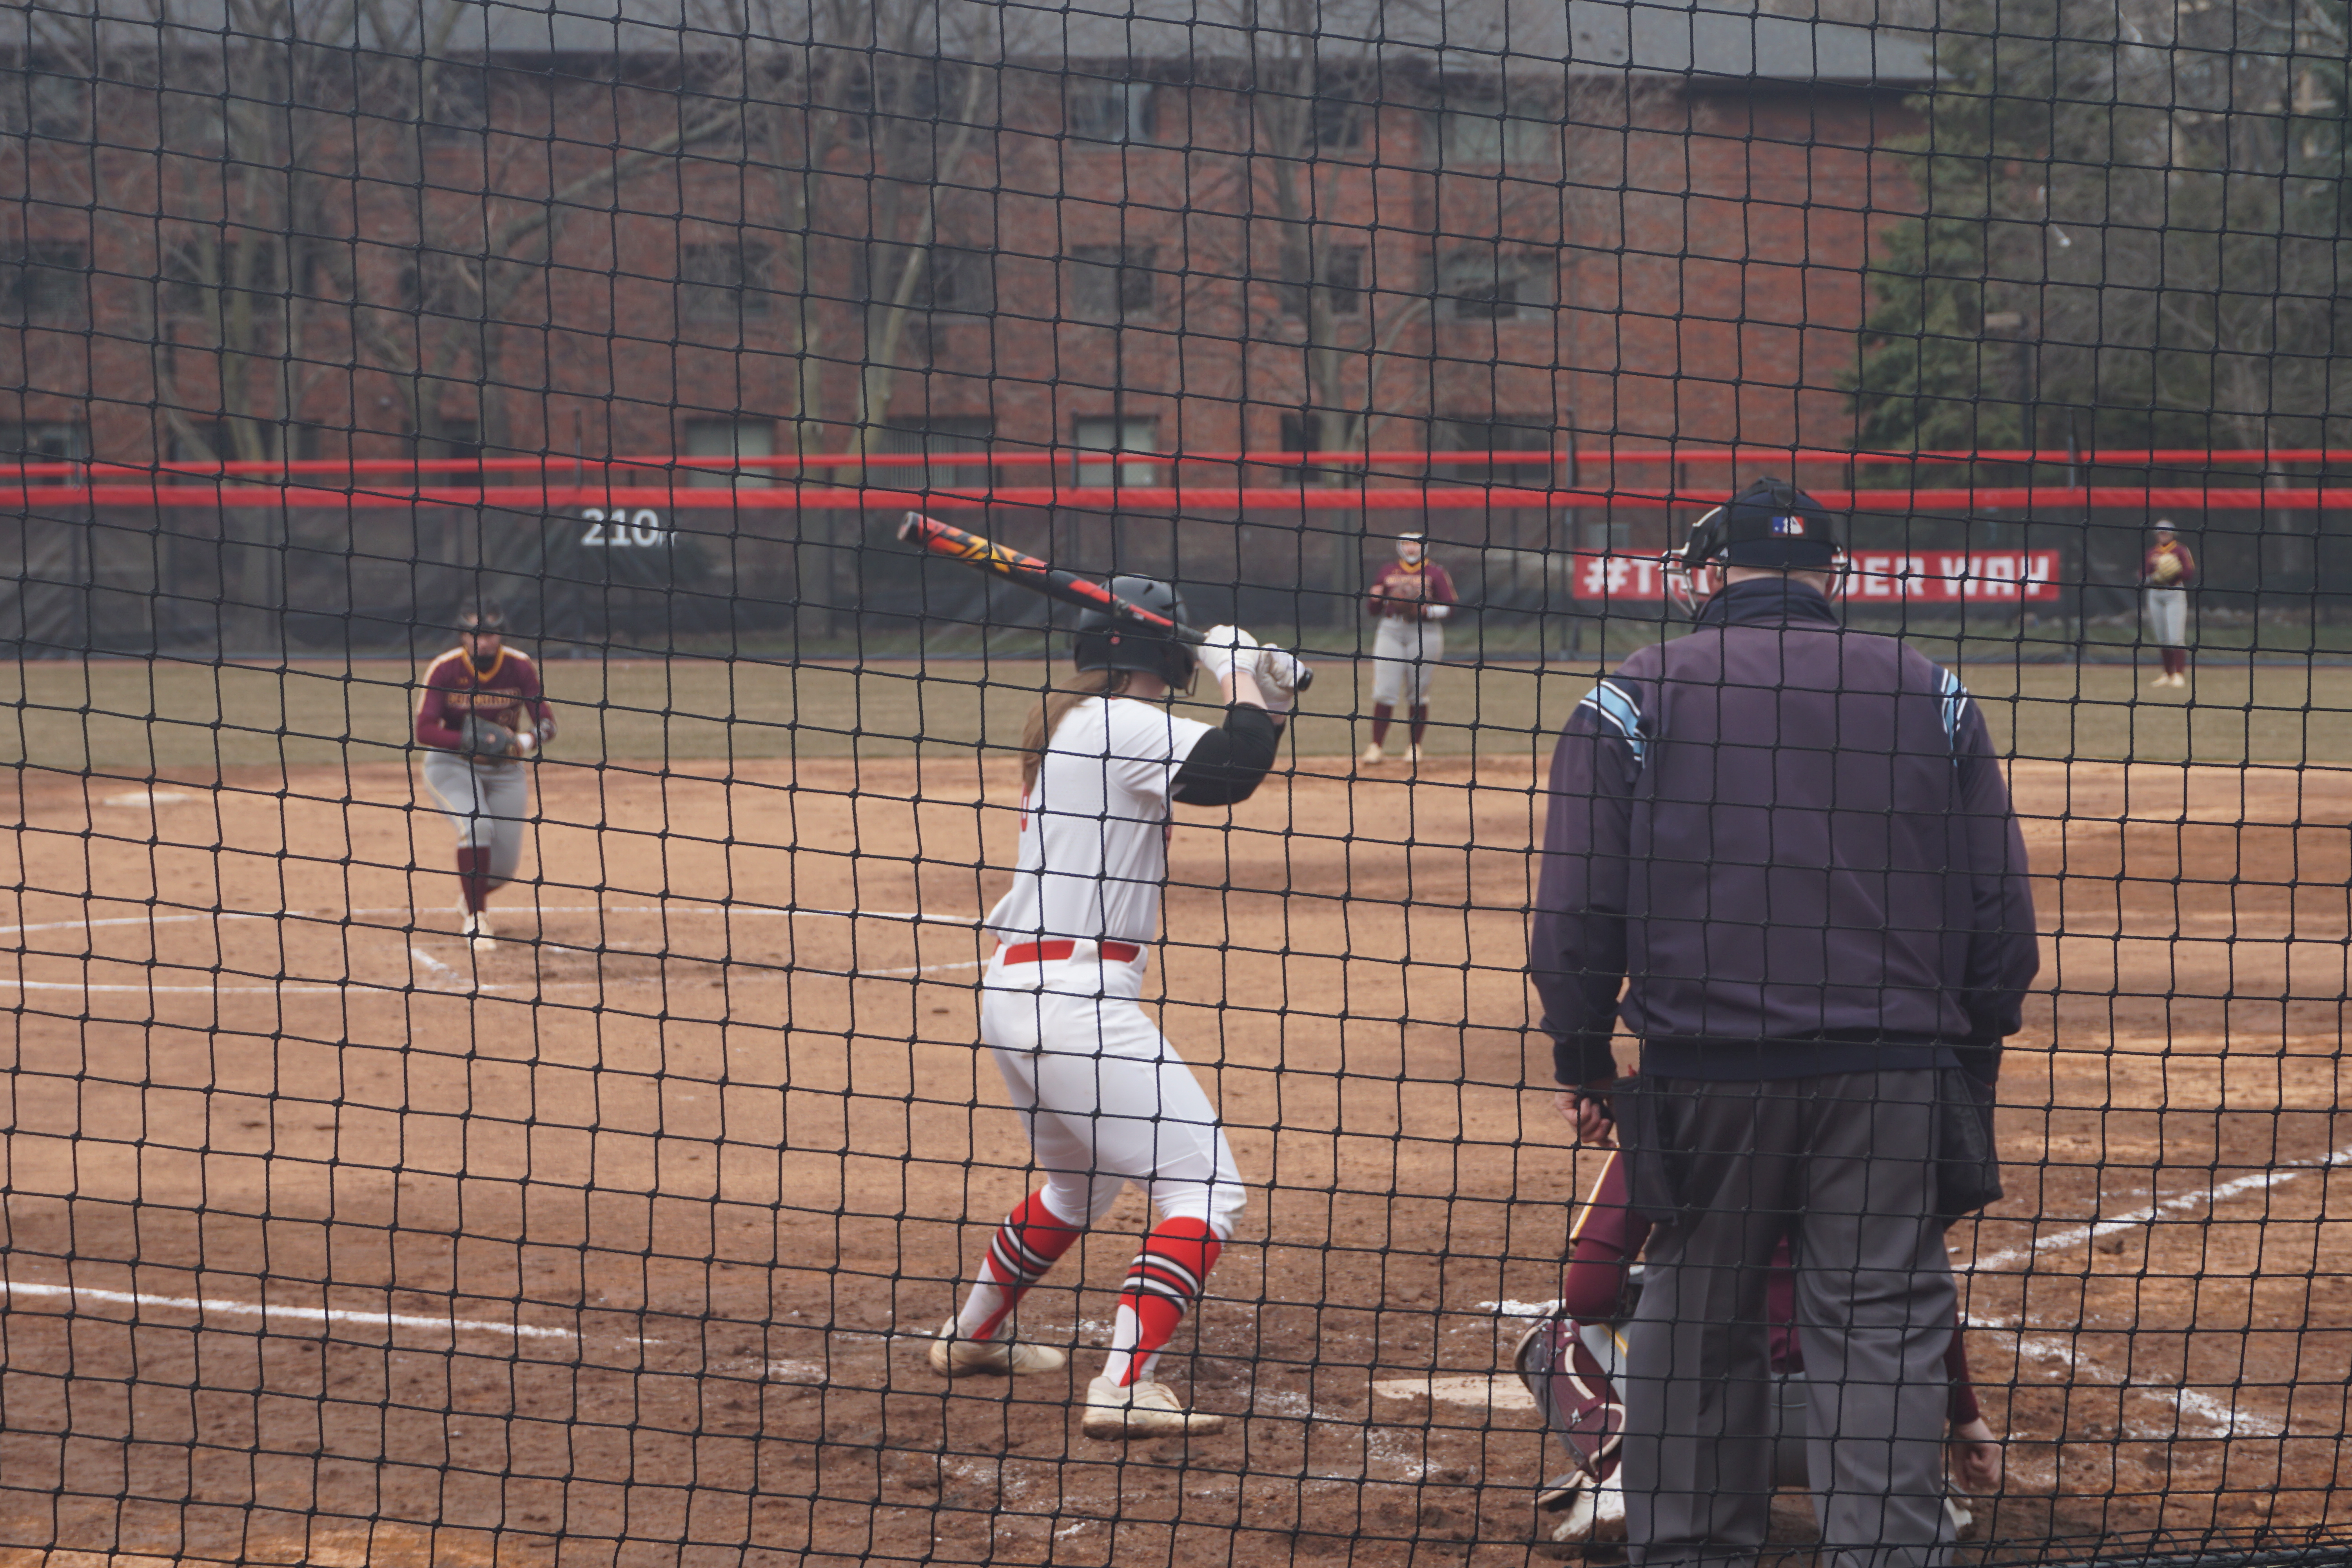
Players competing during a softball game
Real in-game action: power starts with a confident, repeatable swing.
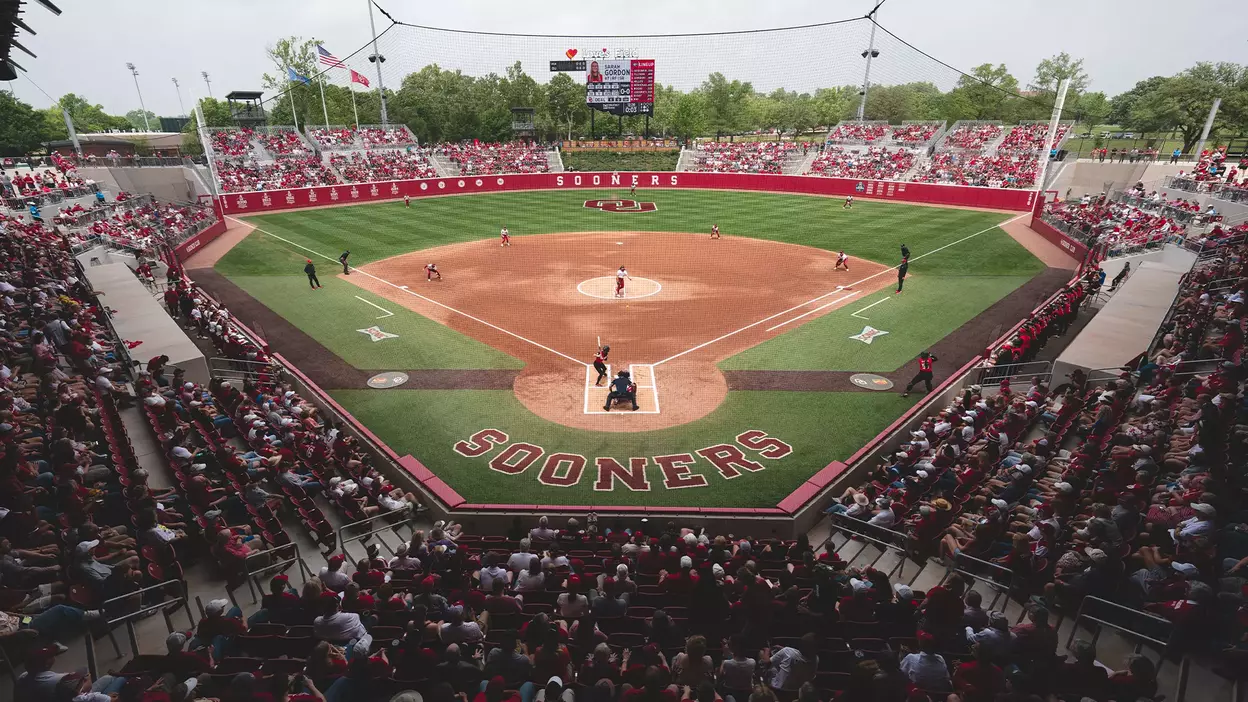
Love's Field, home of University of Oklahoma softball
Love's Field, home of University of Oklahoma softball.
01 / CONTEXT

Power is one way to create offense; getting on base and taking extra bases are others. This dataset lets us compare home runs and stolen bases across player-seasons, but those measures can overlap on the same player.

02 / DATA ANALYSIS

The chart shows the average home runs and stolen bases per player-season in the source file. Its two seasons are a short descriptive snapshot, not evidence that a rule change or strategy shift caused a trend.

03 / LIMITS

Sacrifice bunts are not included in the provided columns, and there are only two seasons here. Use the Stat Explorer to inspect the underlying player records before drawing broader conclusions.

Power and speed in the datasetPlayer-season averages · 2021–2022
Home runs per player-seasonStolen bases per player-season

2021 First season in this file; use it as the within-dataset baseline.

2022 Compare the observed averages; the dataset does not explain why they differ.

Compare team profiles

Team Comparison

Compare the average player-season stat for two teams in one season. These are unweighted player averages, not official team totals.

Team player-season averages

A second look at offense

Small Ball
vs. Power

Home runs and stolen bases can both contribute to scoring, and a player can do both. Compare how often each appears in the available player-seasons.

Player-seasons with at least one eventShare of records by season
At least one home runAt least one stolen base

How to read this: the percentages are not mutually exclusive; the same player-season can count in both groups.

Scope: the CSV contains 2021 and 2022 only. This is a comparison of those records, not a long-term trend or a causal explanation.

Project details

About

People, project, and data behind this softball explorer.

01 / THE PROJECT

Student & project

Name
Alyssa Hillman
New College of Florida
ncf.edu

02 / THE DATA

Source & coverage

The project CSV is identified as NCAA Division I batting statistics from the SCORE Sports Data Repository, covering the 2021 and 2022 seasons. It contains 4,406 player-season records across 302 teams; its conference field is “All Division I,” so conference comparisons are not available. The linked raw file is the copy used by this site.